Overall Performance
You can access your overall performance data by selecting Performance in the main menu.
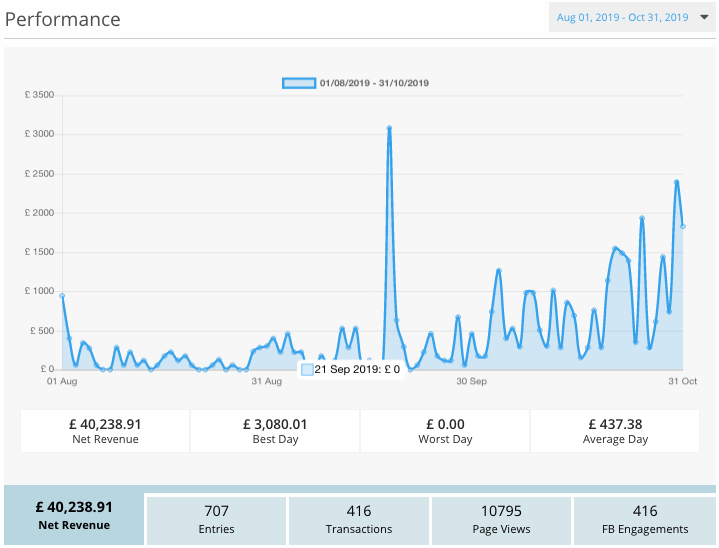
The graph at the top of the page initially will show you net revenue performance for the last 30 days, however, you can enter a specific date range from the drop-down menu in the top right. This menu also provides you with a date comparison option which allows you to compare two different time periods to one another. You will be able to see how your overall performance is from one year to the next, from one month to the next, or you can completely customise your date range to meet your own specific date criteria.
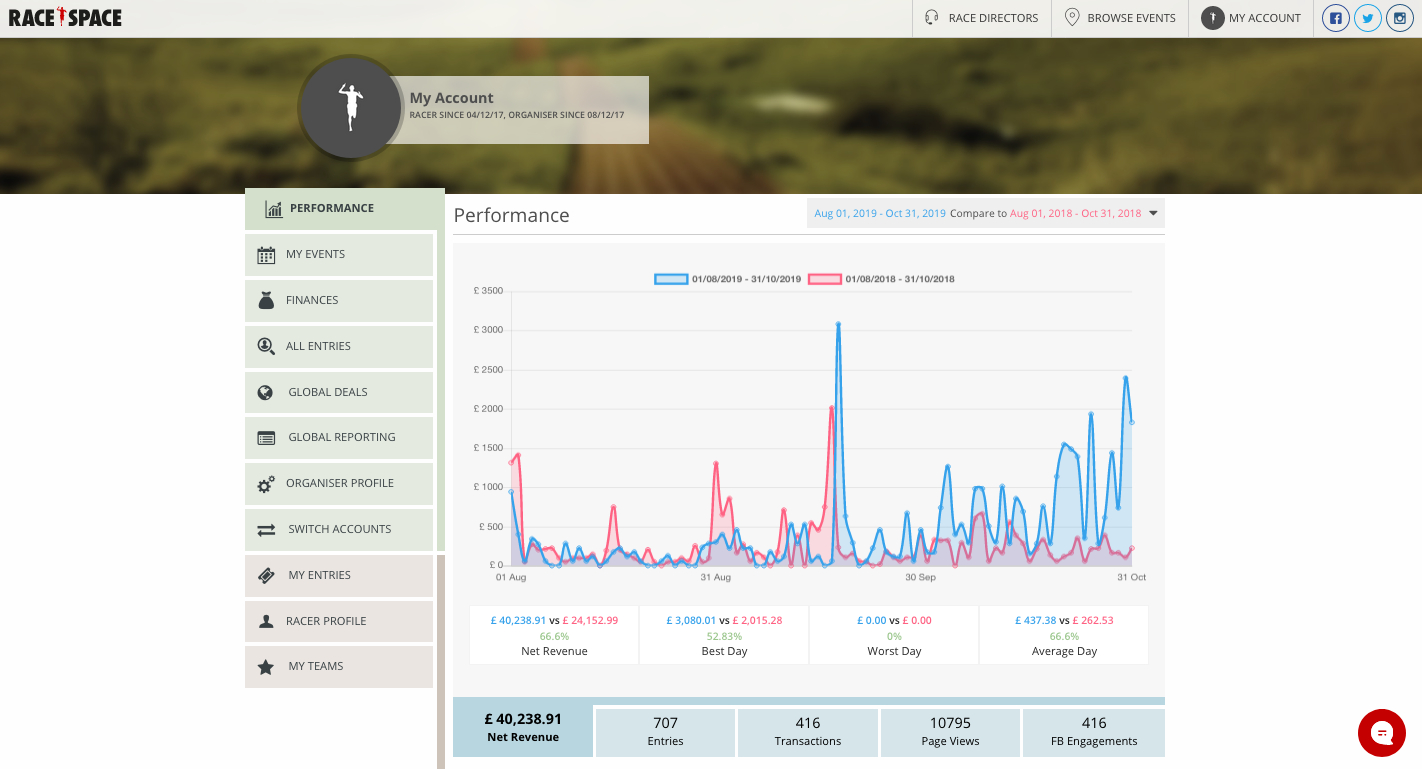
The graph has five main metrics options, which you can switch between using the blue tabs below the graph. These tabs are Net Revenue, Entries, Transactions, Page Views and Facebook Engagements. Select one of these for the data related to them as well as the numerical data on the Best Day, Worst Day and Average Day.
Below is explanation of what each of these main metrics capture:
- Net Revenue: Provides the total amount made from sales (entries, merchandise items, booking protect, transfer fees) minus any outgoings (refunds, chargebacks, refund fees, transfer fee deductions). This data is captured on this tab based on the date range that has been selected in the top right. Should you be using a date comparison for the graph then it will show one net revenue vs. the second net revenue and also show the percentage difference.
- Entries: Provides the total number of entries (tickets purchased) during the date range that has been selected in the top right.
- Transactions: Provides the total number of transactions processed during the date range that has been selected in the top right.
- Page Views: Provides number of the page views for your current live events on the Race Space platform during the date range that has been selected in the top right.
- Facebook Engagement: Provides the number of Facebook engagements from your event listings on the Race Space Facebook page during the date range that has been selected in the top right.
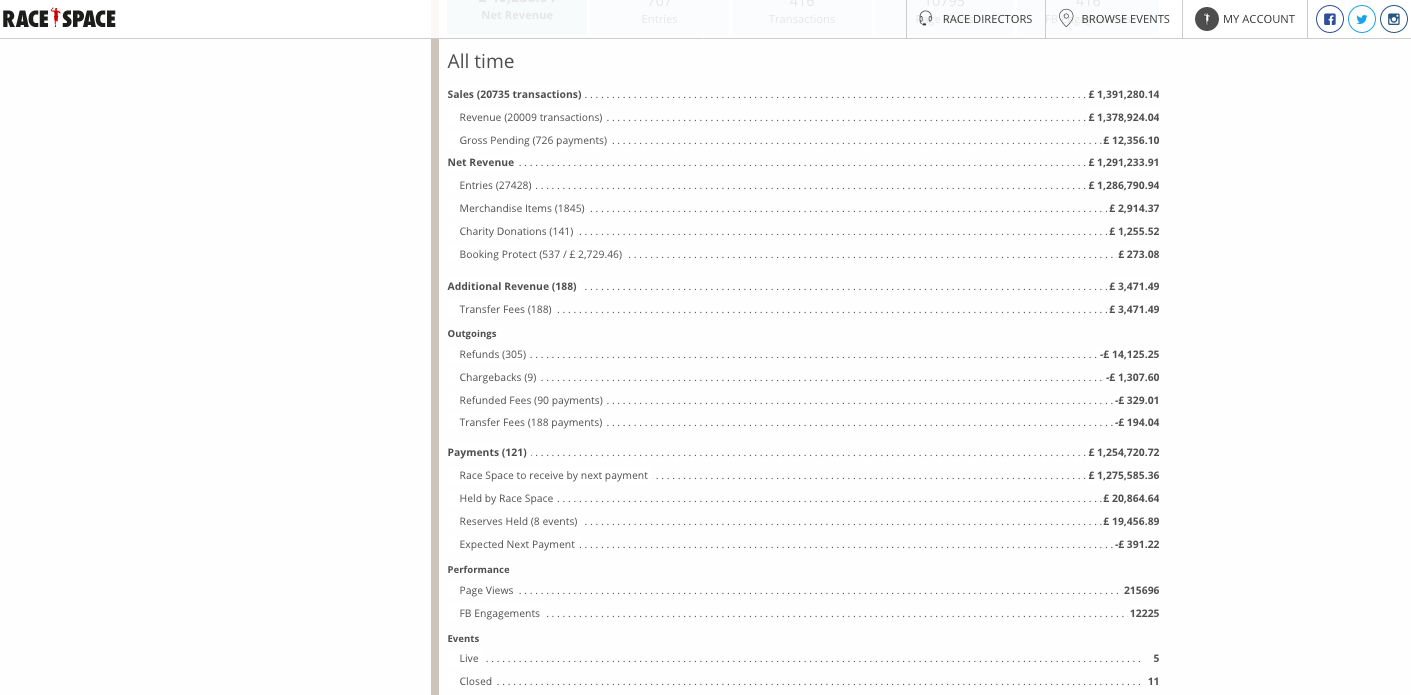
Below this section you will be presented with All Time data across all your events. This data is broken down into the categories of Sales, Net Revenue, Additional Revenue, Outgoings, Payments, Performance and Events.
Click here for a breakdown of the key terms within these categories.
Still stuck? How can we help?

